How to Monitor Website Changes
Fluxguard allows you to monitor website changes with little effort. Track changes to hundreds of web pages on any website. You can also detect HTML changes, content edits, network activity differences, or even pixel or CSS changes to any design element.
Use our proxy network to crawl from anywhere in the world, allowing you to access and track geo-restricted content. In addition, you can monitor changes to password-protected pages or other content that requires form submission.
Our goal with Fluxguard is to provide our customers with comprehensive, prompt, and accurate website change detection. To accomplish this, we offer multiple ways to detect web page changes. And we provide various techniques to eliminate false-positives.
Lets get started! In this tutorial, we explain the basics of setting up website change monitoring.
1. Add a page/site to change monitor
Once you add a site from the dashboard, you will be taken to its Session View.

Think of a session as a series of actions performed across a site. For instance, a session might be creating an account, doing a search, or just visiting the home page.
Once a site is added, a session is created. Most of the time, a single session is sufficient.
However, it is possible to add multiple sessions to monitor different core user paths on any site. This way, you can separate change monitoring tasks into discrete orchestrations, such as account creation, login, product ordering, and more. Each can have its own crawl frequency, settings, filters, and so on.
2. Wait for the initial crawl to complete
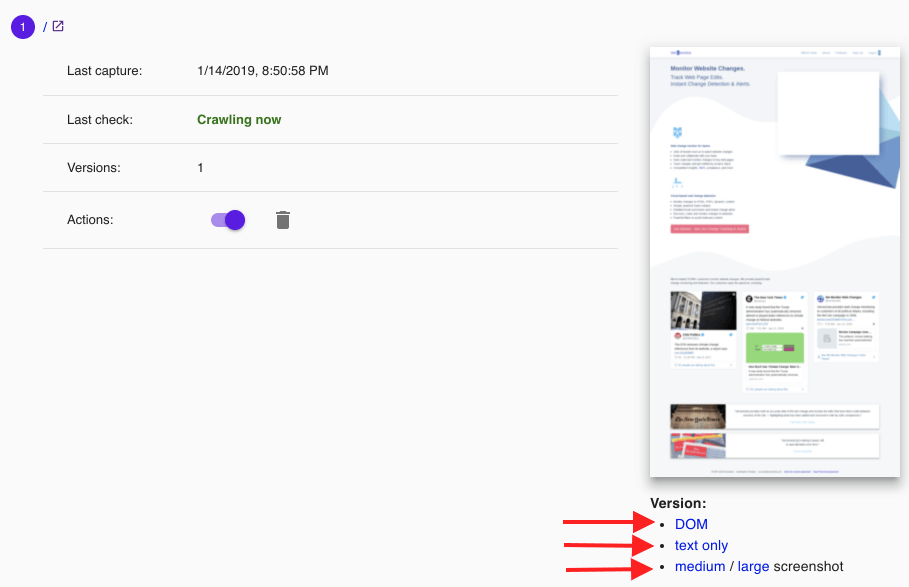
After the initial crawl, take note of the Session View.
We’ve provided multiple ways to analyze the captured version, including screenshots, rendered HTML, network activity, and extracted text.
3. Enable change monitoring for a few more pages
You’ll note we’ve also extracted a list of new URLs. Activate monitoring for a few of these.
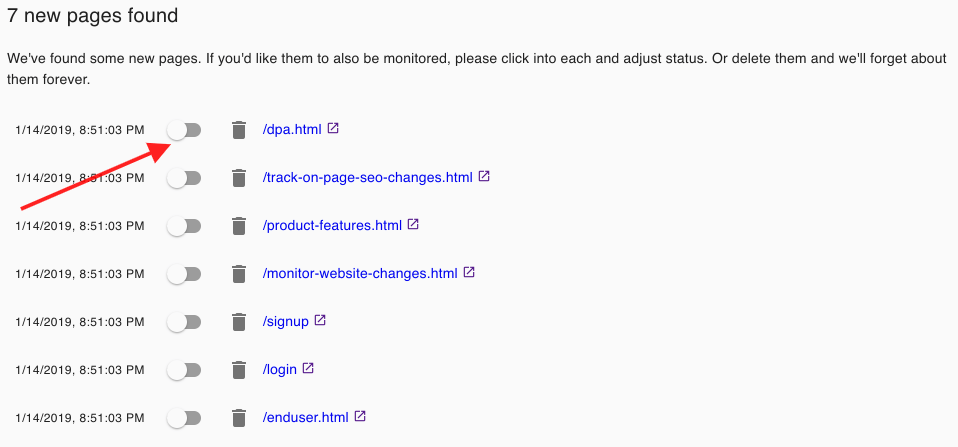
Once more pages are added, you can choose to re-order them. It’s beneficial that sessions preserve cookies (and local storage). Thus, by re-ordering, you change the sequence in which cookies are gathered and retained. This is useful to monitor a more complex user path, such as an account login followed by monitoring a dashboard.
4. Press the “play” button to start another crawl
Let’s start another crawl manually.

Note the drop-down – also on the toolbar – lets you adjust the crawl frequency: crawl every week, every day, or even every few minutes.
5. Let’s see what a change looks like! Click into Session Settings

Session Settings offer many options to fine-tune how we crawl. We’re going to utilize “Exclusion Filters” to strip areas from the monitored site on purpose.
Scroll down and find Exclusion Filters. Filters are powerful ways to reduce false-positives, but we will use them to generate a (simulated) change on the monitored site.
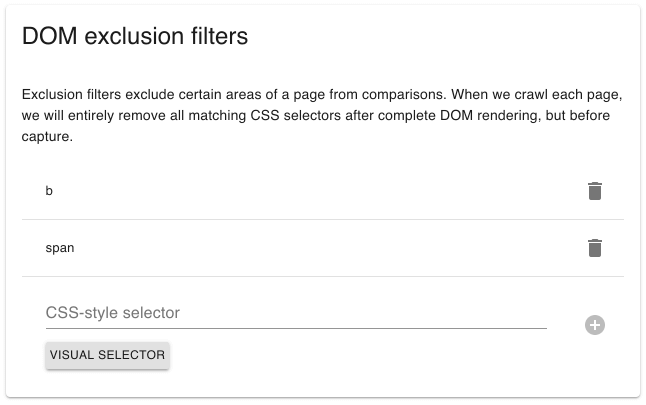
Enter some commonly occurring HTML tags on the monitored site: for example, span, b, div, etc. This will instruct Fluxguard to strip those HTML elements from your site on the next crawl.
6. Click Play again to activate another crawl session
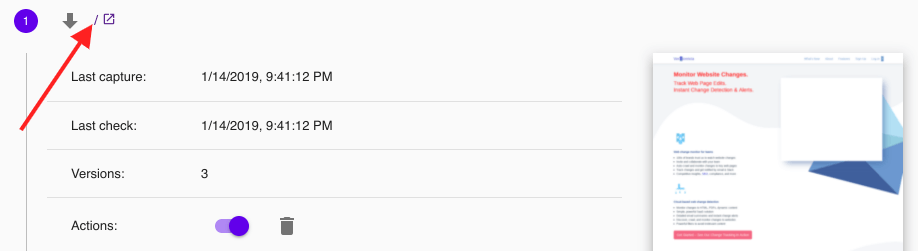
7. Click into the monitored page
Click the link in Page View to inspect all the data captured.
8. Analyze the captured data for each version
We archive an abundance of data! This includes all network activity, cookies, headers, and more. You can explore this interactively on the left-hand side.
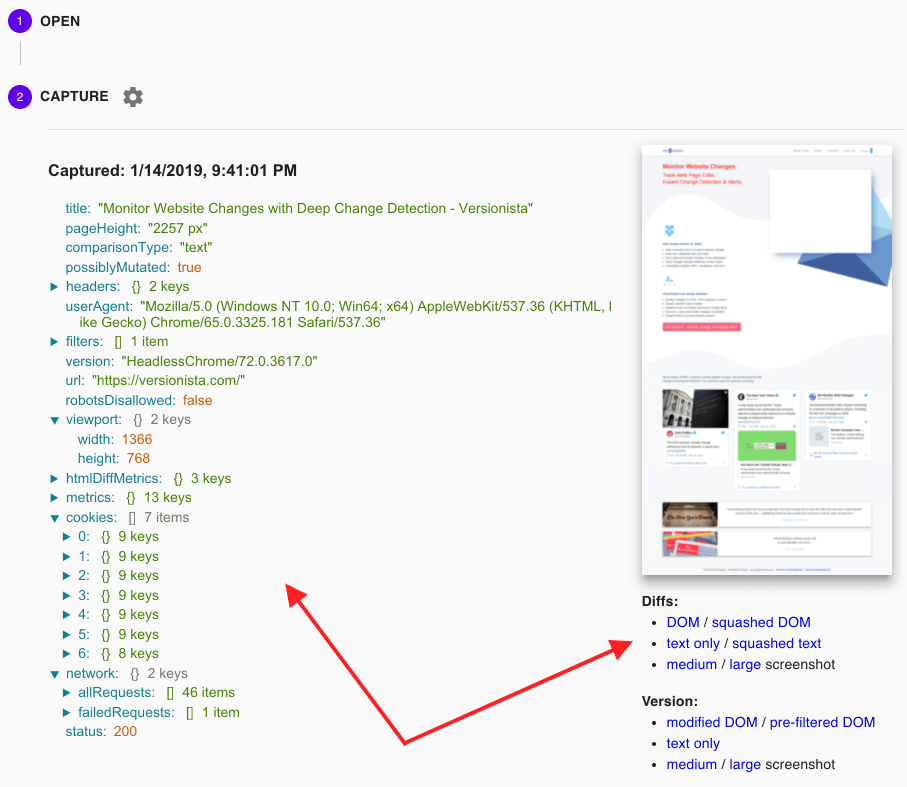
Click on the various diff links below the screenshot.
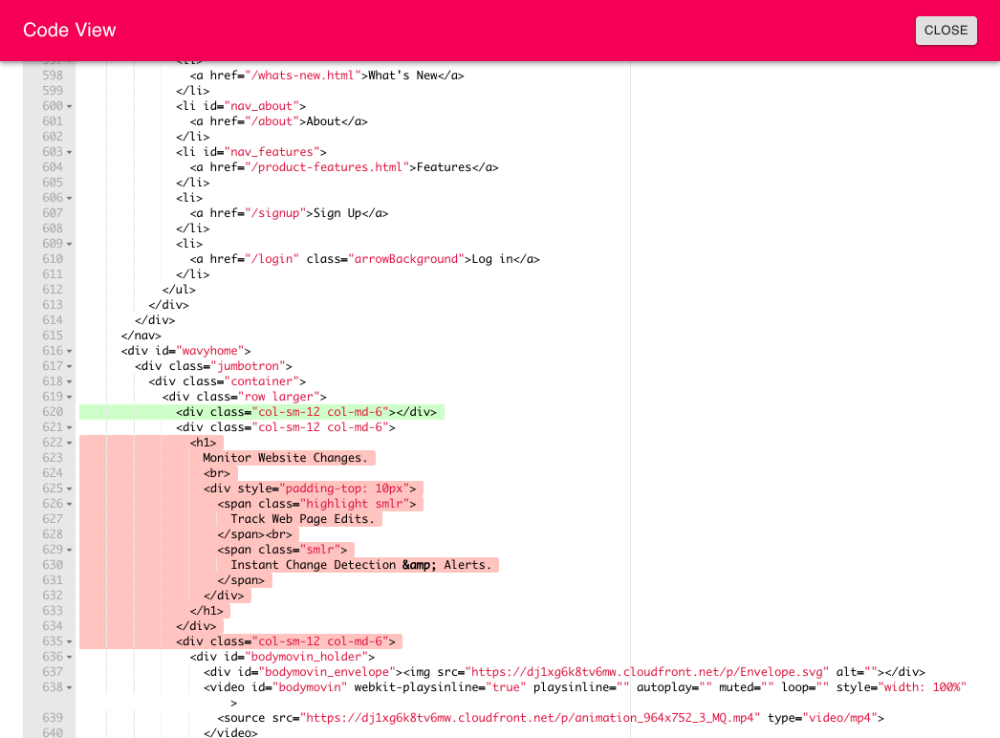
Rendered HTML reveal a color-coded comparison of differences in the rendered DOM. We highlight all additions and deletions. This is a superb method to detect broken deployments and other defects in the core front-end code of a site.
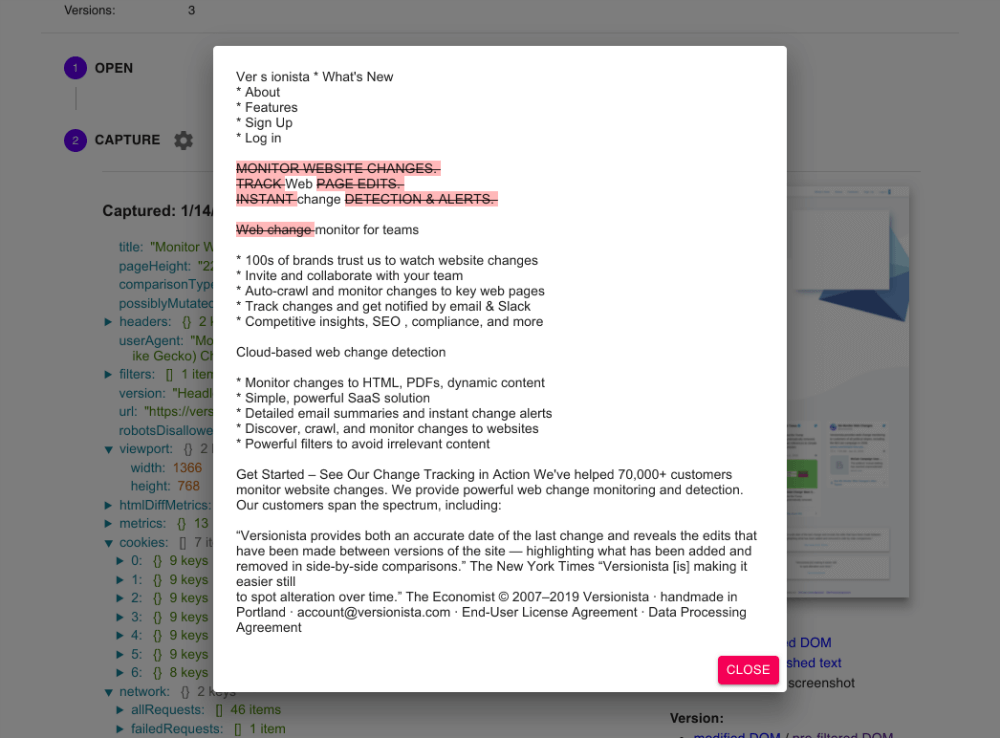
Text differences highlight changes to elements visible to end-users, such as introductory copy, titles, or other text. This comparison is useful to detect changes to key content.
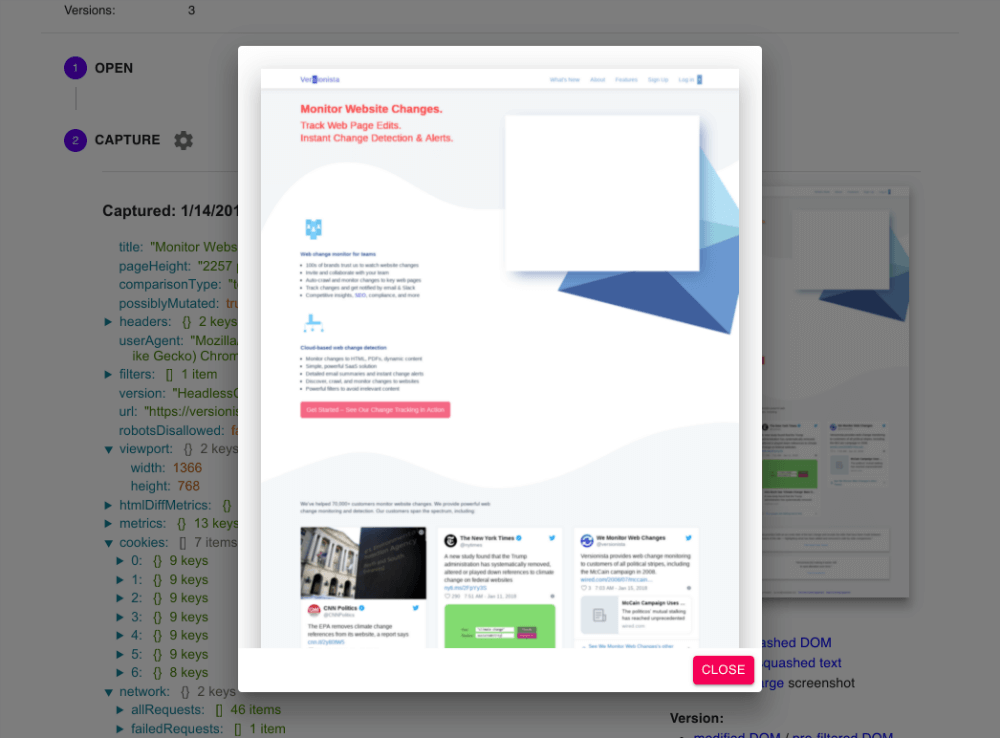
Screenshot comparisons highlight changes from one captured screenshot to another. This helps you detect visual changes, such as CSS, image edits, and so on.
And, in conclusion, we also provide a network diff. This displays changes to network activity: for instance, perhaps a new script or image that loads, or maybe a font is no longer available. This is vital to spot problematic Javascript insertion, for example.
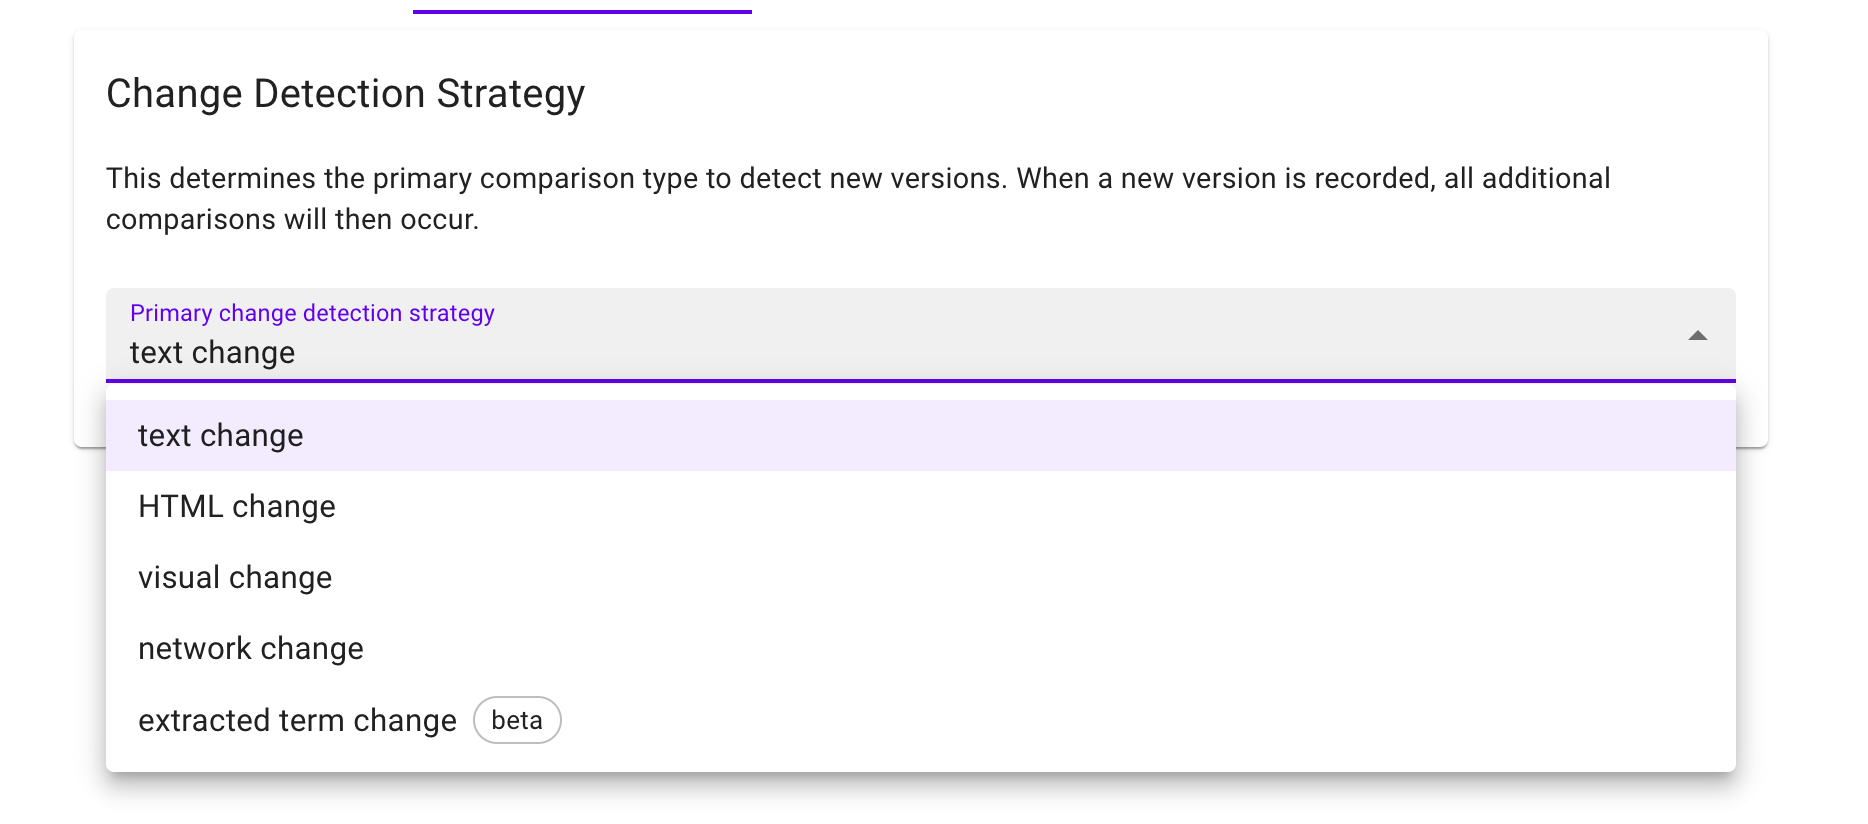
9. (Optional) Adjust primary change detection strategy to HTML, text, network, visual, extracted entity or other comparisons
Fluxguard uses a primary change detection strategy to determine if it should record a new version. By default, Fluxguard looks for changes to extracted text as its primary strategy—namely, text content that end-users see on the page.
Once a change is found, Fluxguard will record a new version and then follow-up with all other comparison types. This means that you will have a complete analysis of all changes, including HTML, text, pixel screenshots, network activity, headers, cookies, extracted entities, and more. But it is that initial text change that triggers these other comparisons.
Many times, customers wish to adjust the primary change detection strategy for their use case. For example, perhaps you want to chiefly monitor pixel changes? No problem. Here’s how...
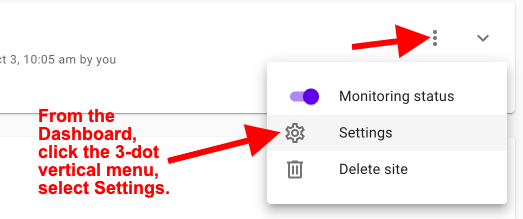
- Go to Session Settings for each site you are monitoring.

- Click on the Detect tab.
- Adjust the primary change detection strategy. Once you do this, Fluxguard will use a different approach to determine when to record a new version. Remember, once a new version is found, Fluxguard will automatically apply all additional change comparisons for you.
Once you make this change, note that there are often advanced options to allow finetuning of each comparison strategy.
10. (Optional) Adjust email report frequency
Summary emails are sent daily, including screenshots and extracted text differences. The frequency of these emails can be adjusted in Account Settings.
11. (Optional) Use generative AI to evaluate and summarize changes
Our generative AI offers powerful ways to assess new and changed pages against your business rules. You can also summarize content. Learn more.